SEO
The Real Cost of Render-Blocking Resources (50-Site Audit)

How does the browser actually get stuck?
Render-blocking resources are the JavaScript and CSS files that force the browser to stop parsing and wait before it can paint a single visible pixel. Any render blocking resources fix worth deploying starts with triage, not tooling. In Gravidy's audit of 50 B2B SaaS sites across DACH, UK, and Nordics markets from January to April 2025, render-blocking resources added a median 1.3 seconds to First Contentful Paint. Thirty-eight percent of sites carried four or more blocking resources at the time of audit. Generic WordPress plugins and blanket defer attributes rarely move the needle on modern SaaS stacks, and this post explains why.
Key Takeaways
50-site Gravidy audit found a median 1.3 second FCP delay from render-blocking resources, with 38% of sites carrying four or more blockers.
Third-party JavaScript (Intercom, Drift, GTM) drove 67% of total blocking delay across the dataset. First-party CSS was a distant second.
Cutting blocking resources in half moved 14 of 19 tested sites from "needs improvement" into Google's "good" LCP band, average improvement 0.7 seconds.
Lighthouse lists flagged resources alphabetically, not by impact, so teams routinely fix the cheapest resources first and leave the heaviest untouched.
What breaks in the critical rendering path?
When the browser parses HTML and hits a standard <script> tag or <link rel="stylesheet">, it stops. It cannot continue building the DOM or CSSOM until that file downloads, parses, and executes. This pause delays every visible pixel, regardless of how fast your server responds.
The critical rendering path needs both DOM and CSSOM to construct the render tree before paint. JavaScript blocks DOM construction. CSS blocks CSSOM construction, and it also blocks any JavaScript that appears below it in the document, because scripts frequently query computed styles. Fonts add a third failure mode: without font-display: swap, text stays invisible while the font downloads. Gravidy's audit found 44% of sites shipped web fonts with no display strategy configured.
TTFB and render-blocking are separate problems. A 200ms server response can still produce a 3-second LCP if the head of your HTML carries 400KB of synchronous JavaScript. DebugBear's teardown of the critical rendering path confirms the same pattern across the sites they profile: blocking resources compound with, but never substitute for, server latency.
What did 50 B2B SaaS sites actually show?
The median site in the Gravidy audit carried three render-blocking resources. One in four sites carried six or more. Google Tag Manager loading synchronously, third-party chat widgets, and unoptimized Google Fonts together produced most of the delay.
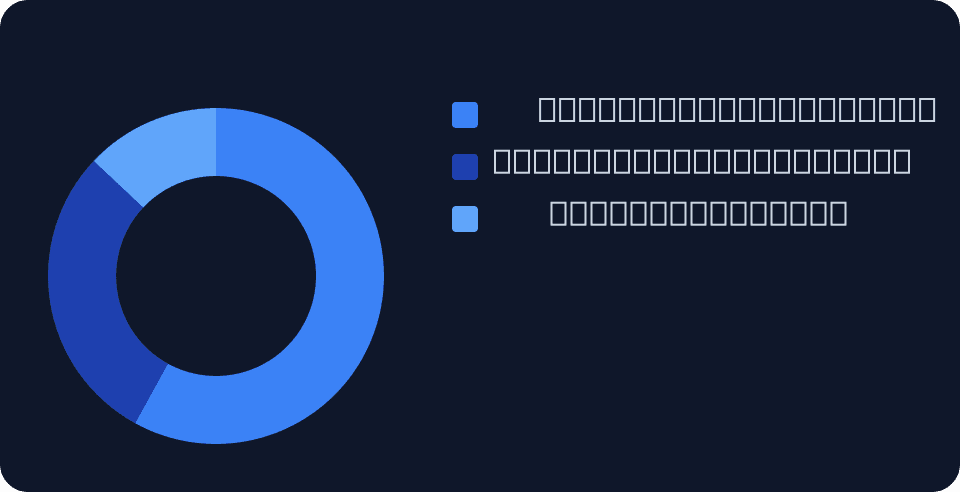
Intercom and Drift alone accounted for 41% of flagged JavaScript across the dataset. Median blocking delay by category came in at roughly 820ms for third-party JS, 310ms for first-party CSS, and 190ms for web fonts. The pattern held across stacks, but the failure mode differed by architecture.
WordPress sites blocked on unminified theme stylesheets and plugin scripts. Webflow sites blocked on Google Fonts and a synchronous jQuery build. Custom React and Next.js SSR sites showed a different signature entirely: they blocked on hydration bundles, not stylesheets, and the Next.js hydration trap tends to hide the problem from stock Lighthouse audits until you inspect the waterfall directly. SSR stacks also carry hidden security risks worth reviewing before shipping aggressive defer strategies.
Why is the SEO cost more than a speed score?
Render-blocking resources degrade LCP and FCP directly, and both feed Google's Core Web Vitals assessment. Sites in the audit that cut blocking resources by half or more saw LCP improve by an average of 0.7 seconds. That shift moved 14 of 19 tested sites from "needs improvement" into Google's "good" threshold.
Google has treated Core Web Vitals as a ranking signal since the Page Experience update rolled out in 2021. The LCP thresholds are clear: under 2.5 seconds is good, 2.5 to 4 seconds needs improvement, above 4 seconds is poor, per web.dev. Mobile amplifies the pain. Gravidy's simulated 4G tests showed blocking delays 1.8x to 3x worse on mobile than desktop, which matters because mobile-first indexing is now the default crawl mode.
There is a second-order cost too. Late-loading stylesheets produce Cumulative Layout Shift when styles apply after content has already rendered. So a render-blocking CSS problem often shows up in a CLS audit as well. Treat them together, not separately. Full context on how these metrics interact for SaaS sites lives in Core Web Vitals for B2B SaaS: The 2026 Reality.
Defer vs async: what does the difference actually mean?
defer downloads the script in parallel with HTML parsing and runs it after the document is fully parsed, in source order. async also downloads in parallel, but executes the moment the file is ready, interrupting parsing. For most B2B SaaS sites, defer is the correct default. async belongs only on fully independent scripts with no dependencies and no DOM interaction.
Attribute | Blocks parsing | Execution order | Best use case |
|---|---|---|---|
(none) | Yes | Synchronous | Scripts that must run before DOM (rare) |
| No | Source order preserved | Analytics, tag managers, anything with DOM dependency |
| No | Whenever ready | Independent trackers, A/B testing pixels |
| No | Deferred by default | ES modules |
The most common mistake Gravidy sees on audit is a script marked async that depends on jQuery or another library loaded below it. This produces intermittent runtime errors, especially on cold cache loads. HubSpot tracking and Intercom can be deferred safely. Stripe.js and payment flows generally cannot. Test each third-party script individually before shipping the attribute change.
Where does critical CSS implementation actually break?
Critical CSS is the subset of styles needed to render above-the-fold content. Inlining it in <head> and deferring the full stylesheet removes the render-blocking CSS flag. The extraction step is where most implementations fail, not the inlining.
Tooling options split into three camps: Penthouse handles viewport-based extraction from a Node.js script, the Critical npm package integrates with Gulp or Webpack, and Next.js App Router now handles critical CSS automatically for App Router pages. The Sentry engineering team's breakdown walks through the manual inlining flow if you need a reference implementation.
The over-inlining mistake is subtle. Inlining more than 14KB of CSS eliminates HTTP caching benefits and bloats every HTML response. In Gravidy audits of sites that attempted manual critical CSS extraction, the median inlined block ran 38KB, far past the useful threshold. Verify the actual first-paint CSS using Chrome DevTools Coverage tab. It shows exactly what executed on paint versus what loaded unused, which is the only honest way to size your critical block.
React and Next.js SSR complicates things. Client-side extraction tools see an empty viewport when they render server-side output. Use framework-native solutions (styled-components SSR, CSS Modules with Next.js) rather than fighting extraction tools that were not built for hydrated markup.
How do you triage 12 flagged resources?
Not all flagged resources carry equal weight. Lighthouse orders them by URL, not by potential savings in milliseconds. Cross-reference the "Estimated Savings" column with real-user field data from the Chrome User Experience Report (CrUX), then fix the heaviest third-party scripts first. First-party CSS optimizations carry a higher ROI than most teams expect.
The triage framework Gravidy uses on audit runs in three steps. Sort every flagged resource by "Potential Savings" in milliseconds from the Lighthouse Performance panel, not the summary Opportunities view. Label each resource as first-party or third-party, and note whether deferring it would break a user-facing feature. Then fix in order: high-ms third-party with no feature dependency, high-ms first-party CSS, everything else.
Watch for false positives. Roughly a fifth of flagged resources in the Gravidy dataset were already loading via preload hints and had near-zero real-world impact on field data. Lighthouse flags them anyway because it evaluates the lab environment, not the production waterfall. Cross-check with CrUX before spending engineering time on a fix that will not move a metric. Teams weighing where performance work fits alongside authority signals should also review how E-E-A-T factors in before reallocating an entire sprint to page speed alone.
Frequently Asked Questions
How do I remove render-blocking JavaScript from my site?
Add defer to script tags that do not need to run before the DOM is ready. For third-party scripts loaded via a tag manager, set the container itself to load asynchronously and configure individual tags to fire after DOM Interactive rather than on page load. This handles most vendor snippets without code changes to the tags themselves.
What is the difference between defer and async in JavaScript?
Both attributes let the browser continue parsing HTML while the script downloads. The difference is execution timing. defer waits until parsing is complete and respects source order. async fires as soon as the file is ready, regardless of order. Scripts with dependencies on other scripts should use defer. Standalone tracking pixels can use async.
How do I implement critical CSS without breaking my design?
Extract critical CSS using Penthouse or the Critical npm package against a representative viewport size (1200x800 for desktop, 375x812 for mobile). Inline the output in <head>. Load the full stylesheet with <link rel="preload"> and an onload handler that swaps it to rel="stylesheet" after load. Test across five or more page templates, not just the homepage.
The fixes worth doing this quarter
Render-blocking resources are fixable. What the 50-site audit made clear is that the Lighthouse flag alone is a poor guide for where to start. The actual cost sits in the heaviest third-party scripts, not the stylesheets teams usually reach for first. Fixing in the right order, with defer and async applied correctly and critical CSS extracted rather than guessed, moved most tested sites out of Google's "needs improvement" LCP band inside a single sprint.
If your Lighthouse report keeps flagging blocking resources and your Core Web Vitals scores have not moved in six months despite the "fixes" your team has shipped, the problem is triage, not effort. If you want to know which fixes are draining your traffic, book a Free SEO Audit Call. Thirty minutes, specific findings against the 50-site benchmark data, no slide decks.